
.svg)


Property seekers get active as home lending interest rates lower. The national average asking price has lifted in a tight market and we’ve seen all-time asking price highs in Manawatu-Wanganui, Otago and Northland regions, since records began over 12 years ago. The lowest total number of homes are for sale nationally, for the first time since 2016.
Download the full New Zealand Property Report as a PDF, or watch our video update below.
New Zealanders got active on realestate.co.nz in August, with more than one million unique browsers to the site, with new users growing by more than 24.0% compared to August 2018.
This coincided with banks lowering home loan interest rates following the Reserve Bank’s cutting of the Official Cash Rate (OCR) earlier in the month.
“The rates cut took the country by surprise,” says realestate.co.nz spokesperson Vanessa Taylor.
“Prospective home buyers can look at the property market with fresh eyes in terms of affordability, either for a first home or for those looking to move up the property ladder with a higher level of equity.”
August is typically one of the quietest months for the property market, but reports are coming in from real estate agents that it’s like an early spring in terms of buyer interest, despite the cold weather, says Vanessa.
“The feedback we’re getting from the real estate industry is that home hunters are doing their homework, looking at what they could now buy in the lower interest rate environment,” she says.
“There have also been reports of a lift in the number of people attending auctions and open homes, researching the type of property they could get for their money.”
“When it comes to buying a home, affordability has always been the primary consideration for most people. The interest rate drop will be a game-changer when it comes to the range of choice,” says Vanessa.
Kiwibank General Manager Borrowing and Investments Chris Greig, says the bank has certainly seen increased first home buyer activity year-on-year.
“Even more so at Kiwibank which attracts first home buyers.”
“This is a direct result of lower servicing costs due to the low rate environment. Kiwibank’s 3.55% market-leading one-year rate represents the significantly lower cost of borrowing.”
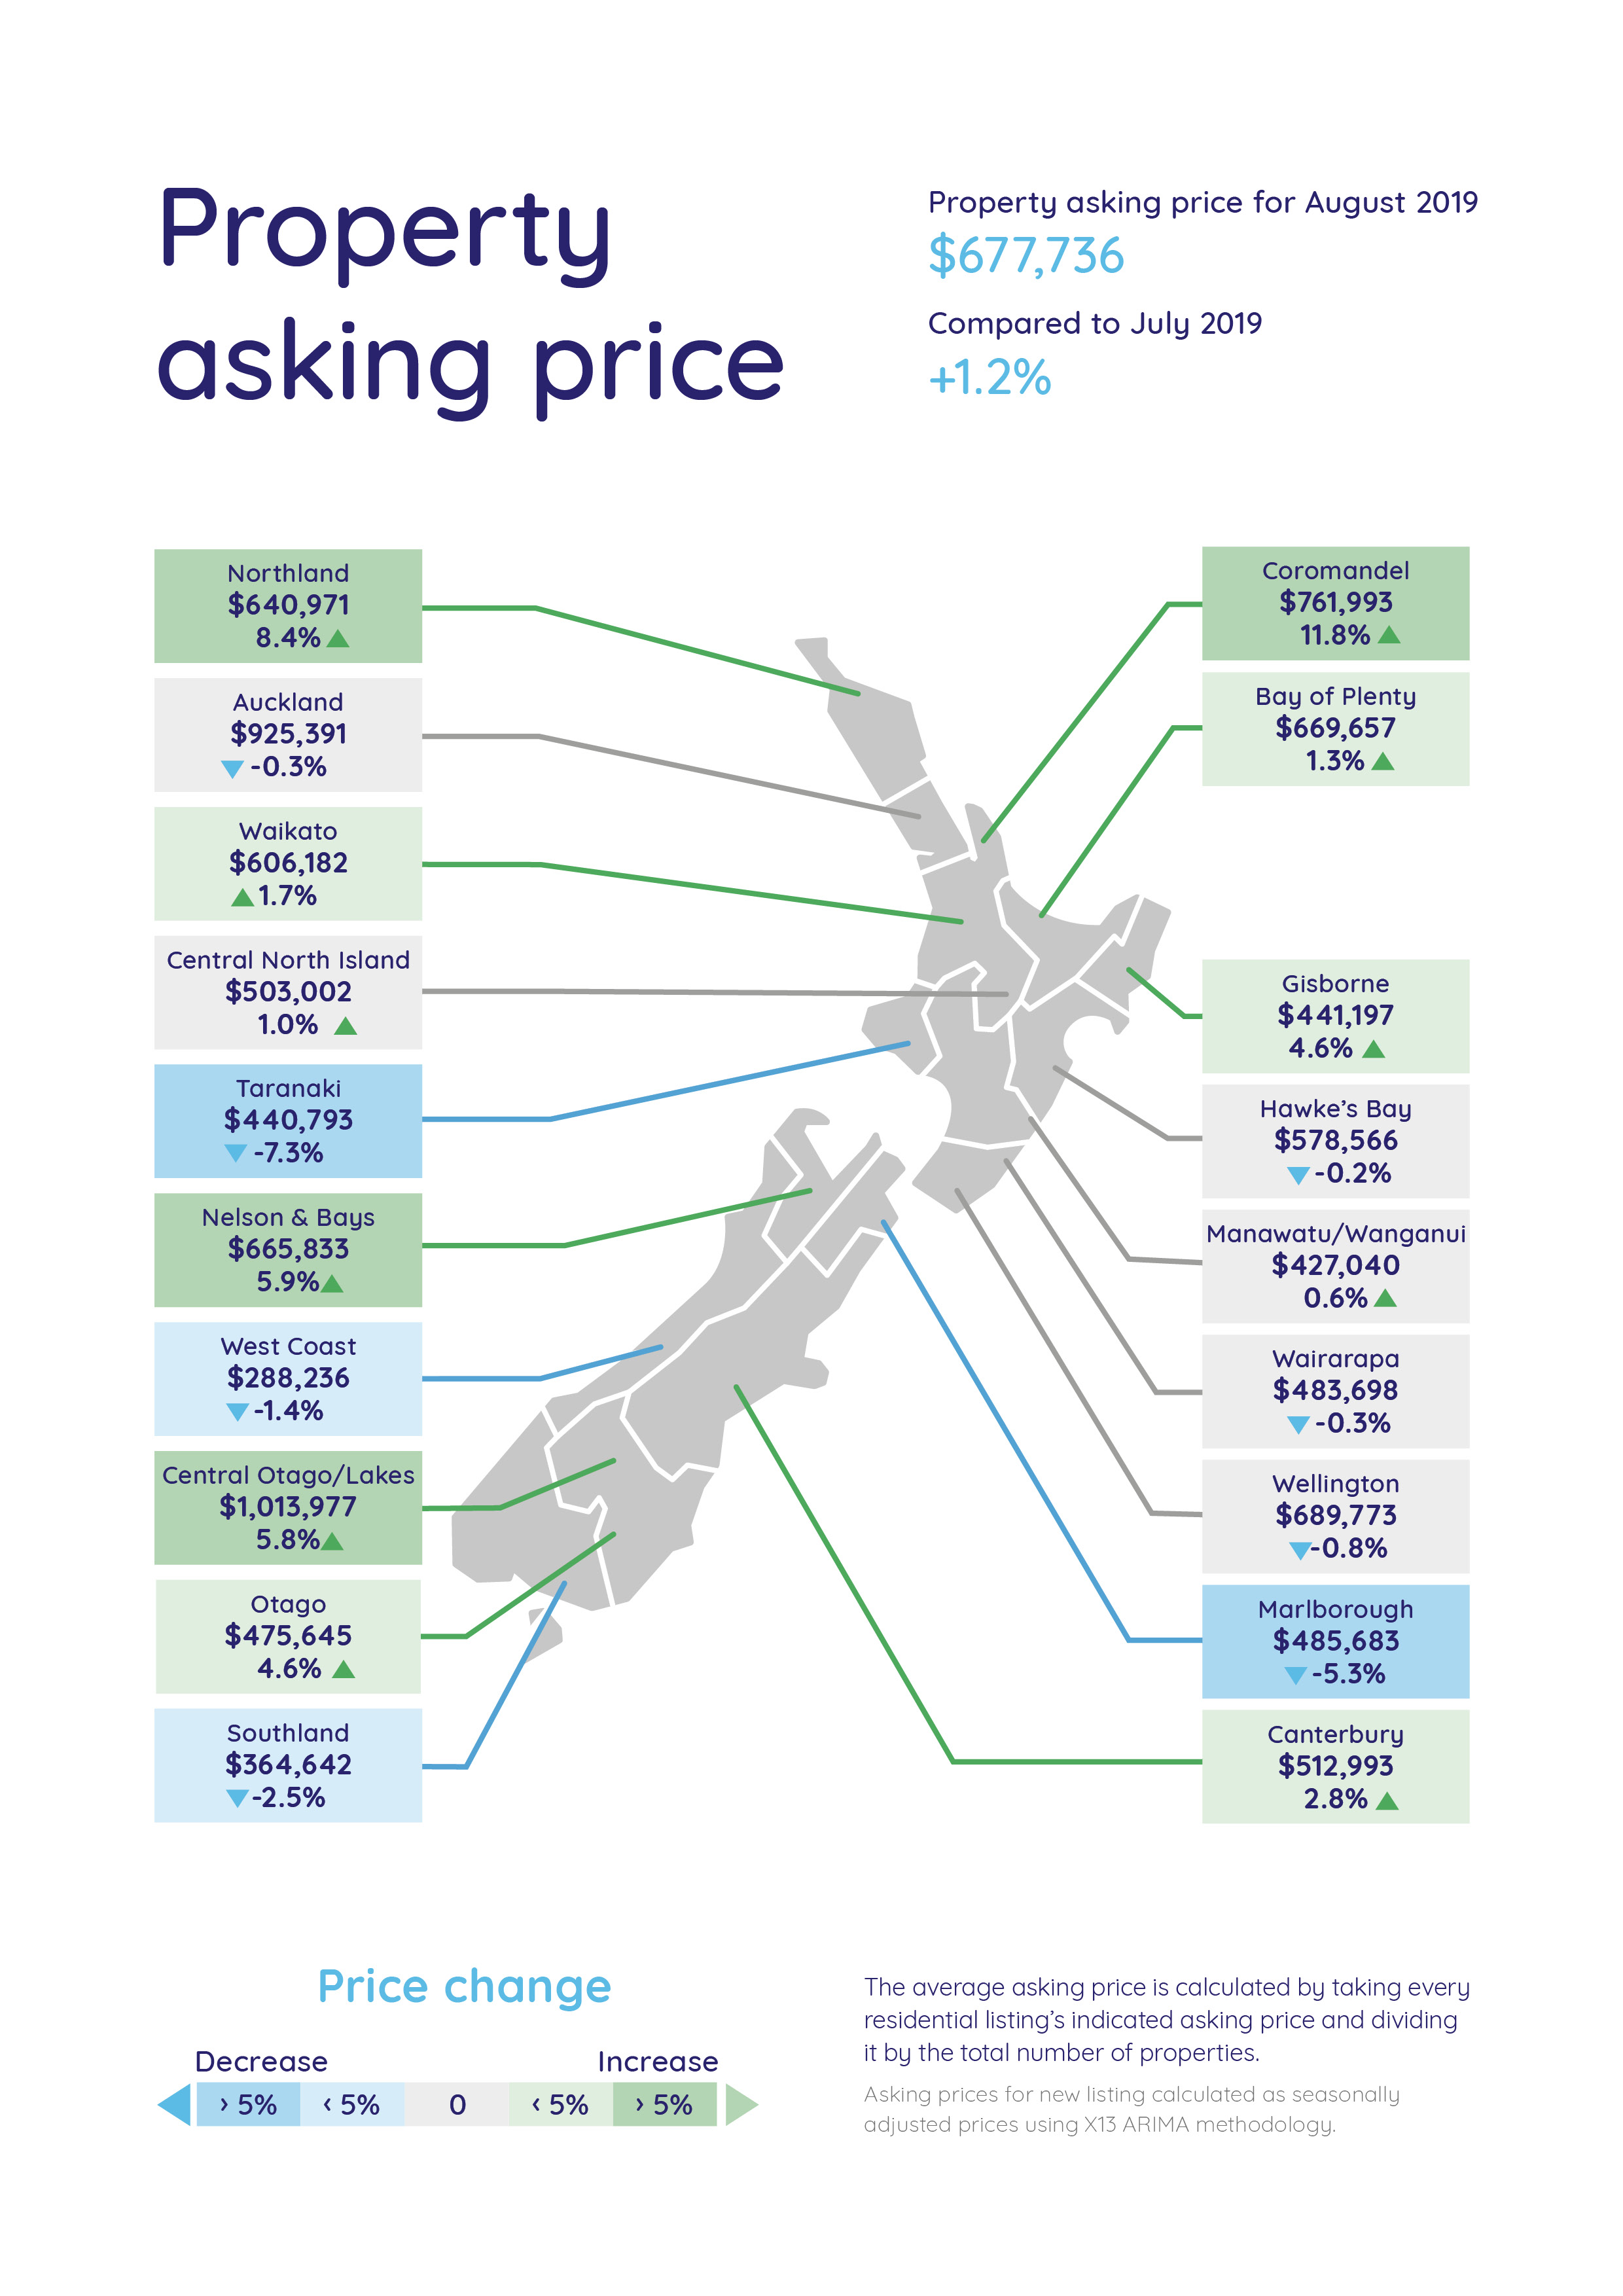
National average asking price lifts, with record highs in the Manawatu-Wanganui, Otago and Northland regions
The average asking price for a home in New Zealand in August was $677,736, a 1.2% increase on the previous month.
Of all the regions, the Manawatu-Wanganui region has been a stand-out in 2019 when it comes to record asking price highs, says Vanessa Taylor.
Five of the past eight months, the region has hit an all-time asking price high since our records began over 12 years ago.
“While at times the incremental increases have been small, the Manawatu-Wanganui region keeps beating its own record,” says Vanessa.
In August, the average asking price reached $427,040, a 0.6% increase on the prior month.
It was a similar story for the Otago region, which has hit record asking price highs three times since the beginning of 2019.
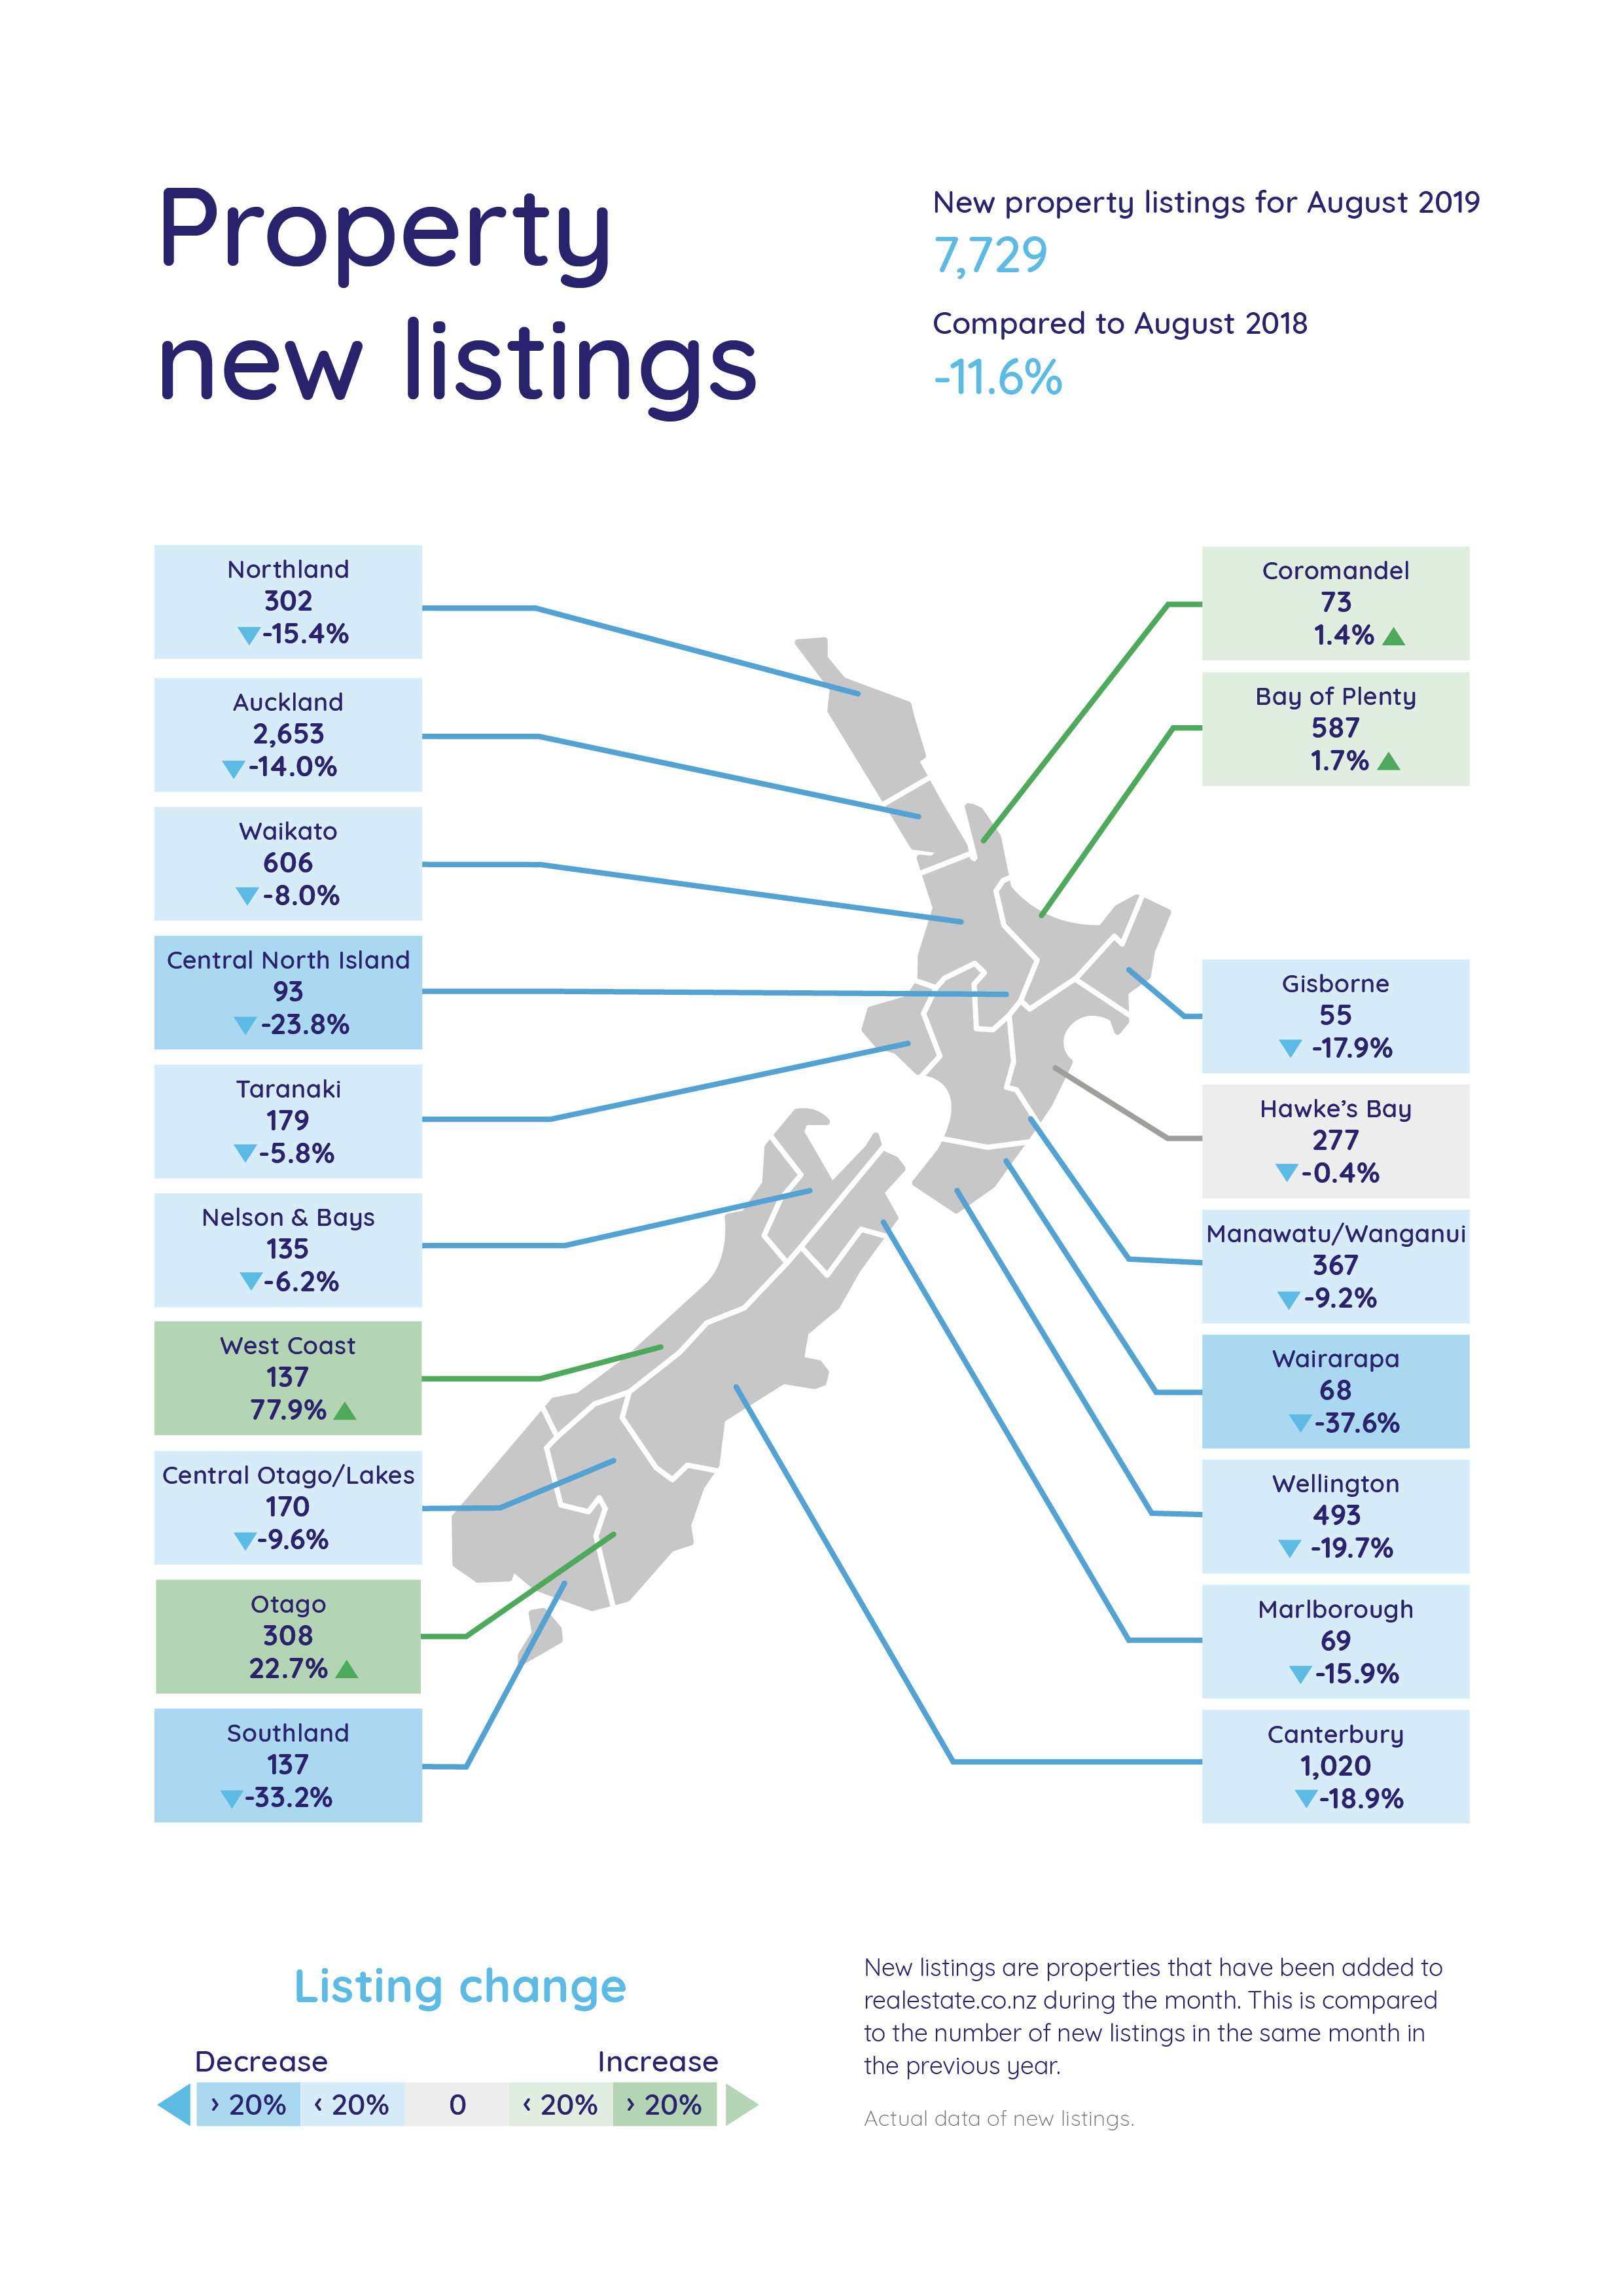
In August, the Otago region’s average asking price lifted by 4.6% to a record $475,645. In the same month the region had a significant injection of fresh listings, with 308 homes newly listed. This represented a 22.7% increase in new listings compared to August 2018.
At the other end of the country, the Northland region also registered a record average asking price in August on the back of a significant drop in the number of new listings.
Northland’s average asking price lifted by 8.4% compared to July 2019, to $640,971.
New listings in Northland fell 15.4% compared to August 2018 (down 302). However, the total number of homes on the market is up 12.1% on the same time last year to 1,318.
“It’s an interesting mix of property fundamentals, while there are few new homes to market there is a healthy pool of total listings for buyers to choose from,” says Vanessa.
Auckland region - new listings down and static average asking price
“Auckland has been relatively stagnant for some time now and we will be closely observing the impact of the fall in home lending rates could have on the region,” says Vanessa.
“Anecdotally, we’re hearing that activity from potential buyers and sellers has already lifted, so it’s more about to what level and how quickly this could translate into transactions,” says Vanessa.
The region’s average asking price remained flat at $925,391, while new listings dropped back 14.0% to 2,653. The total number of homes for sale in August increased slightly by 1.8% to 7,956 when compared with August 2018.
Bindi Norwell, Chief Executive at REINZ says the Auckland market seems to be finding an equilibrium between buyers and sellers regarding price expectation.
“With some signs of optimism in the Auckland market, it will be interesting to see what happens over the coming months in terms of both volume and price,” she says.
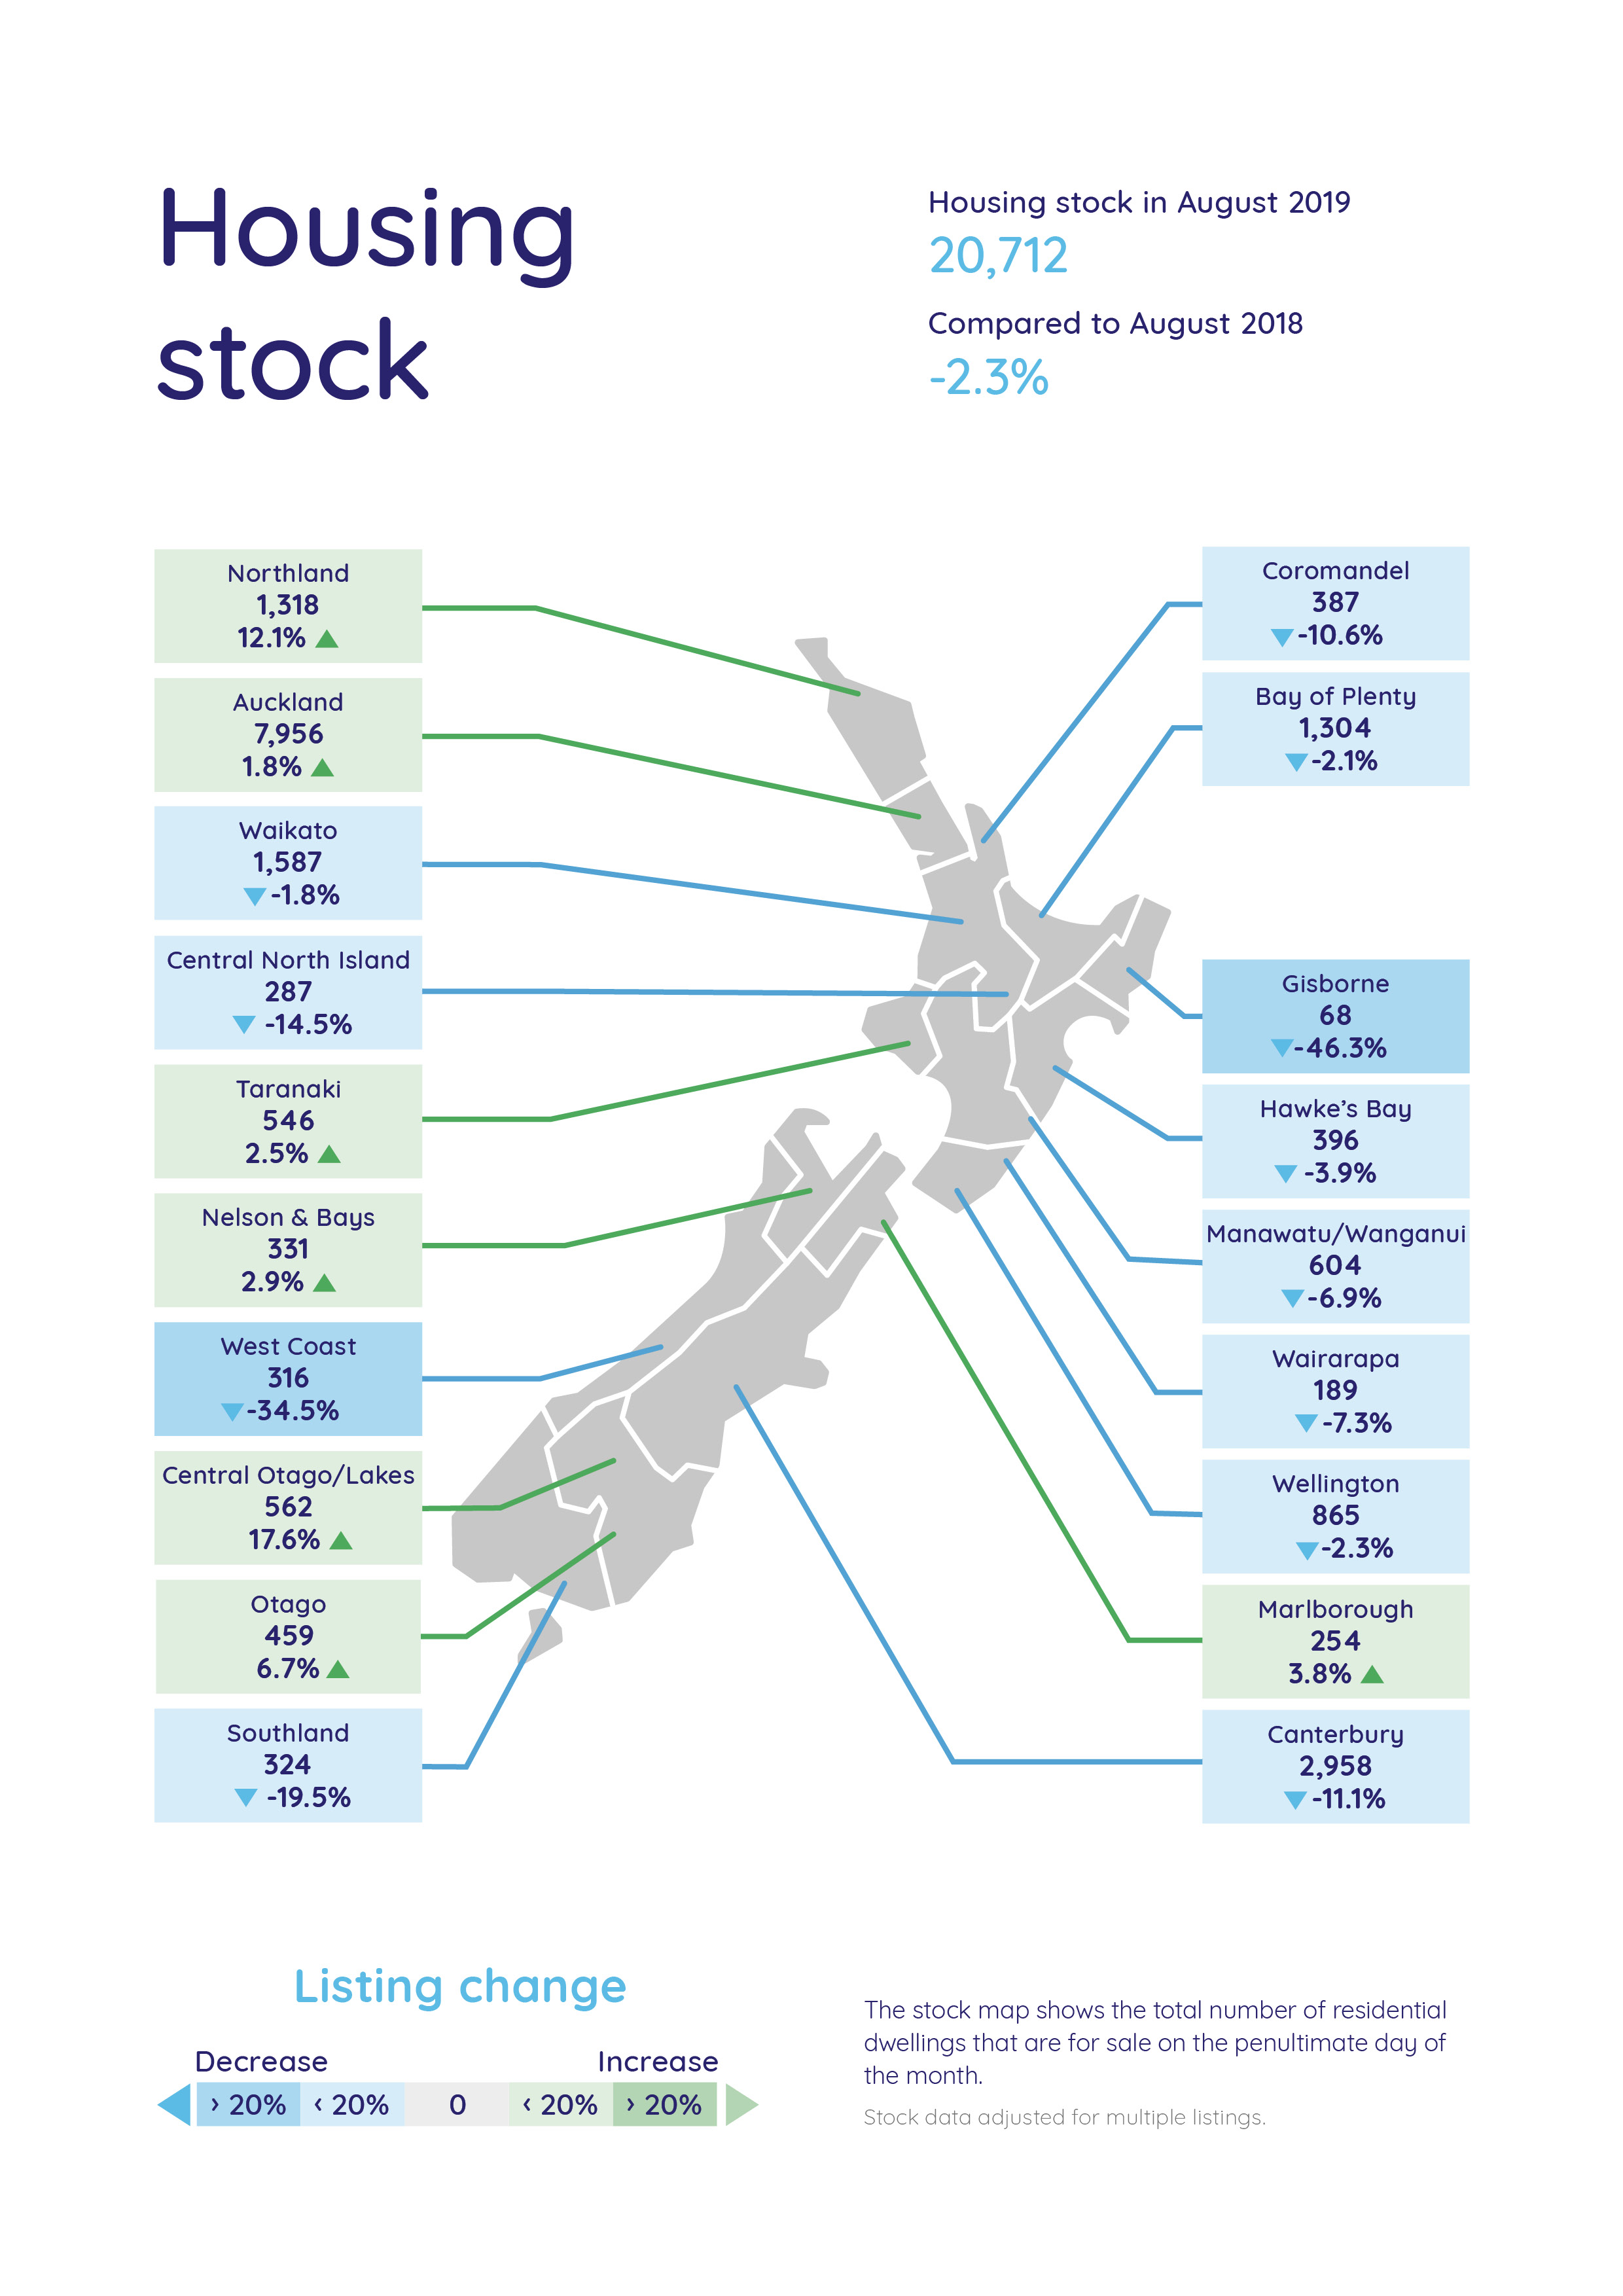
Lowest number of homes for sale nationally since 2016 – record lows in 7 regions
August is typically a quiet winter month, so while there have been large numbers of potential buyers actively looking at homes following the fall in interest rates, the selection of properties was limited.
This August there were a total of 20,712 homes for sale across the country and only 7,729 of these homes were fresh new listings on the market.
“Nationally, we haven’t seen total stock levels this low since July 2016,” says Vanessa Taylor.
Of the 19 regions across New Zealand, only seven had increases in total stock levels, while 12 recorded falls compared with August 2018.
“What’s more, seven regions had record all-time lows in the number of homes for sale in any one month since records began over 12 years ago,” says Vanessa.
This drop in total stock was influenced by the number of new listings on the market in August, which was down 11.6% to 7,729 homes, when compared to August 2018.
“With the surprise interest rate cuts in August, we will be watching to see how this could translate to increased listing activity, particularly in spring which has traditionally been when sellers go to market as the weather improves.”
“In the meantime, people are doing their homework on the implications of the interest rate cuts and what it could mean for them in the housing market.”
Seven regions with record low housing stock for sale in any one month since records began in 2007 (from north to south):
For media interviews or further information contact:
Trish Fitzsimons | 021 022 96927 | trish@realestate.co.nz
Sally Haysom | 022 124 7321
Glossary of terms:
As the only provider of real estate data in real-time, realestate.co.nz offers valuable property market information not available from other sources.
- Average asking price is not a valuation. It is an indication of current market sentiment. Statistically, asking prices tend to correlate closely with the sales prices recorded in future months when those properties are sold. As it looks at different data, average asking prices may differ from recorded sales data released at the same time.
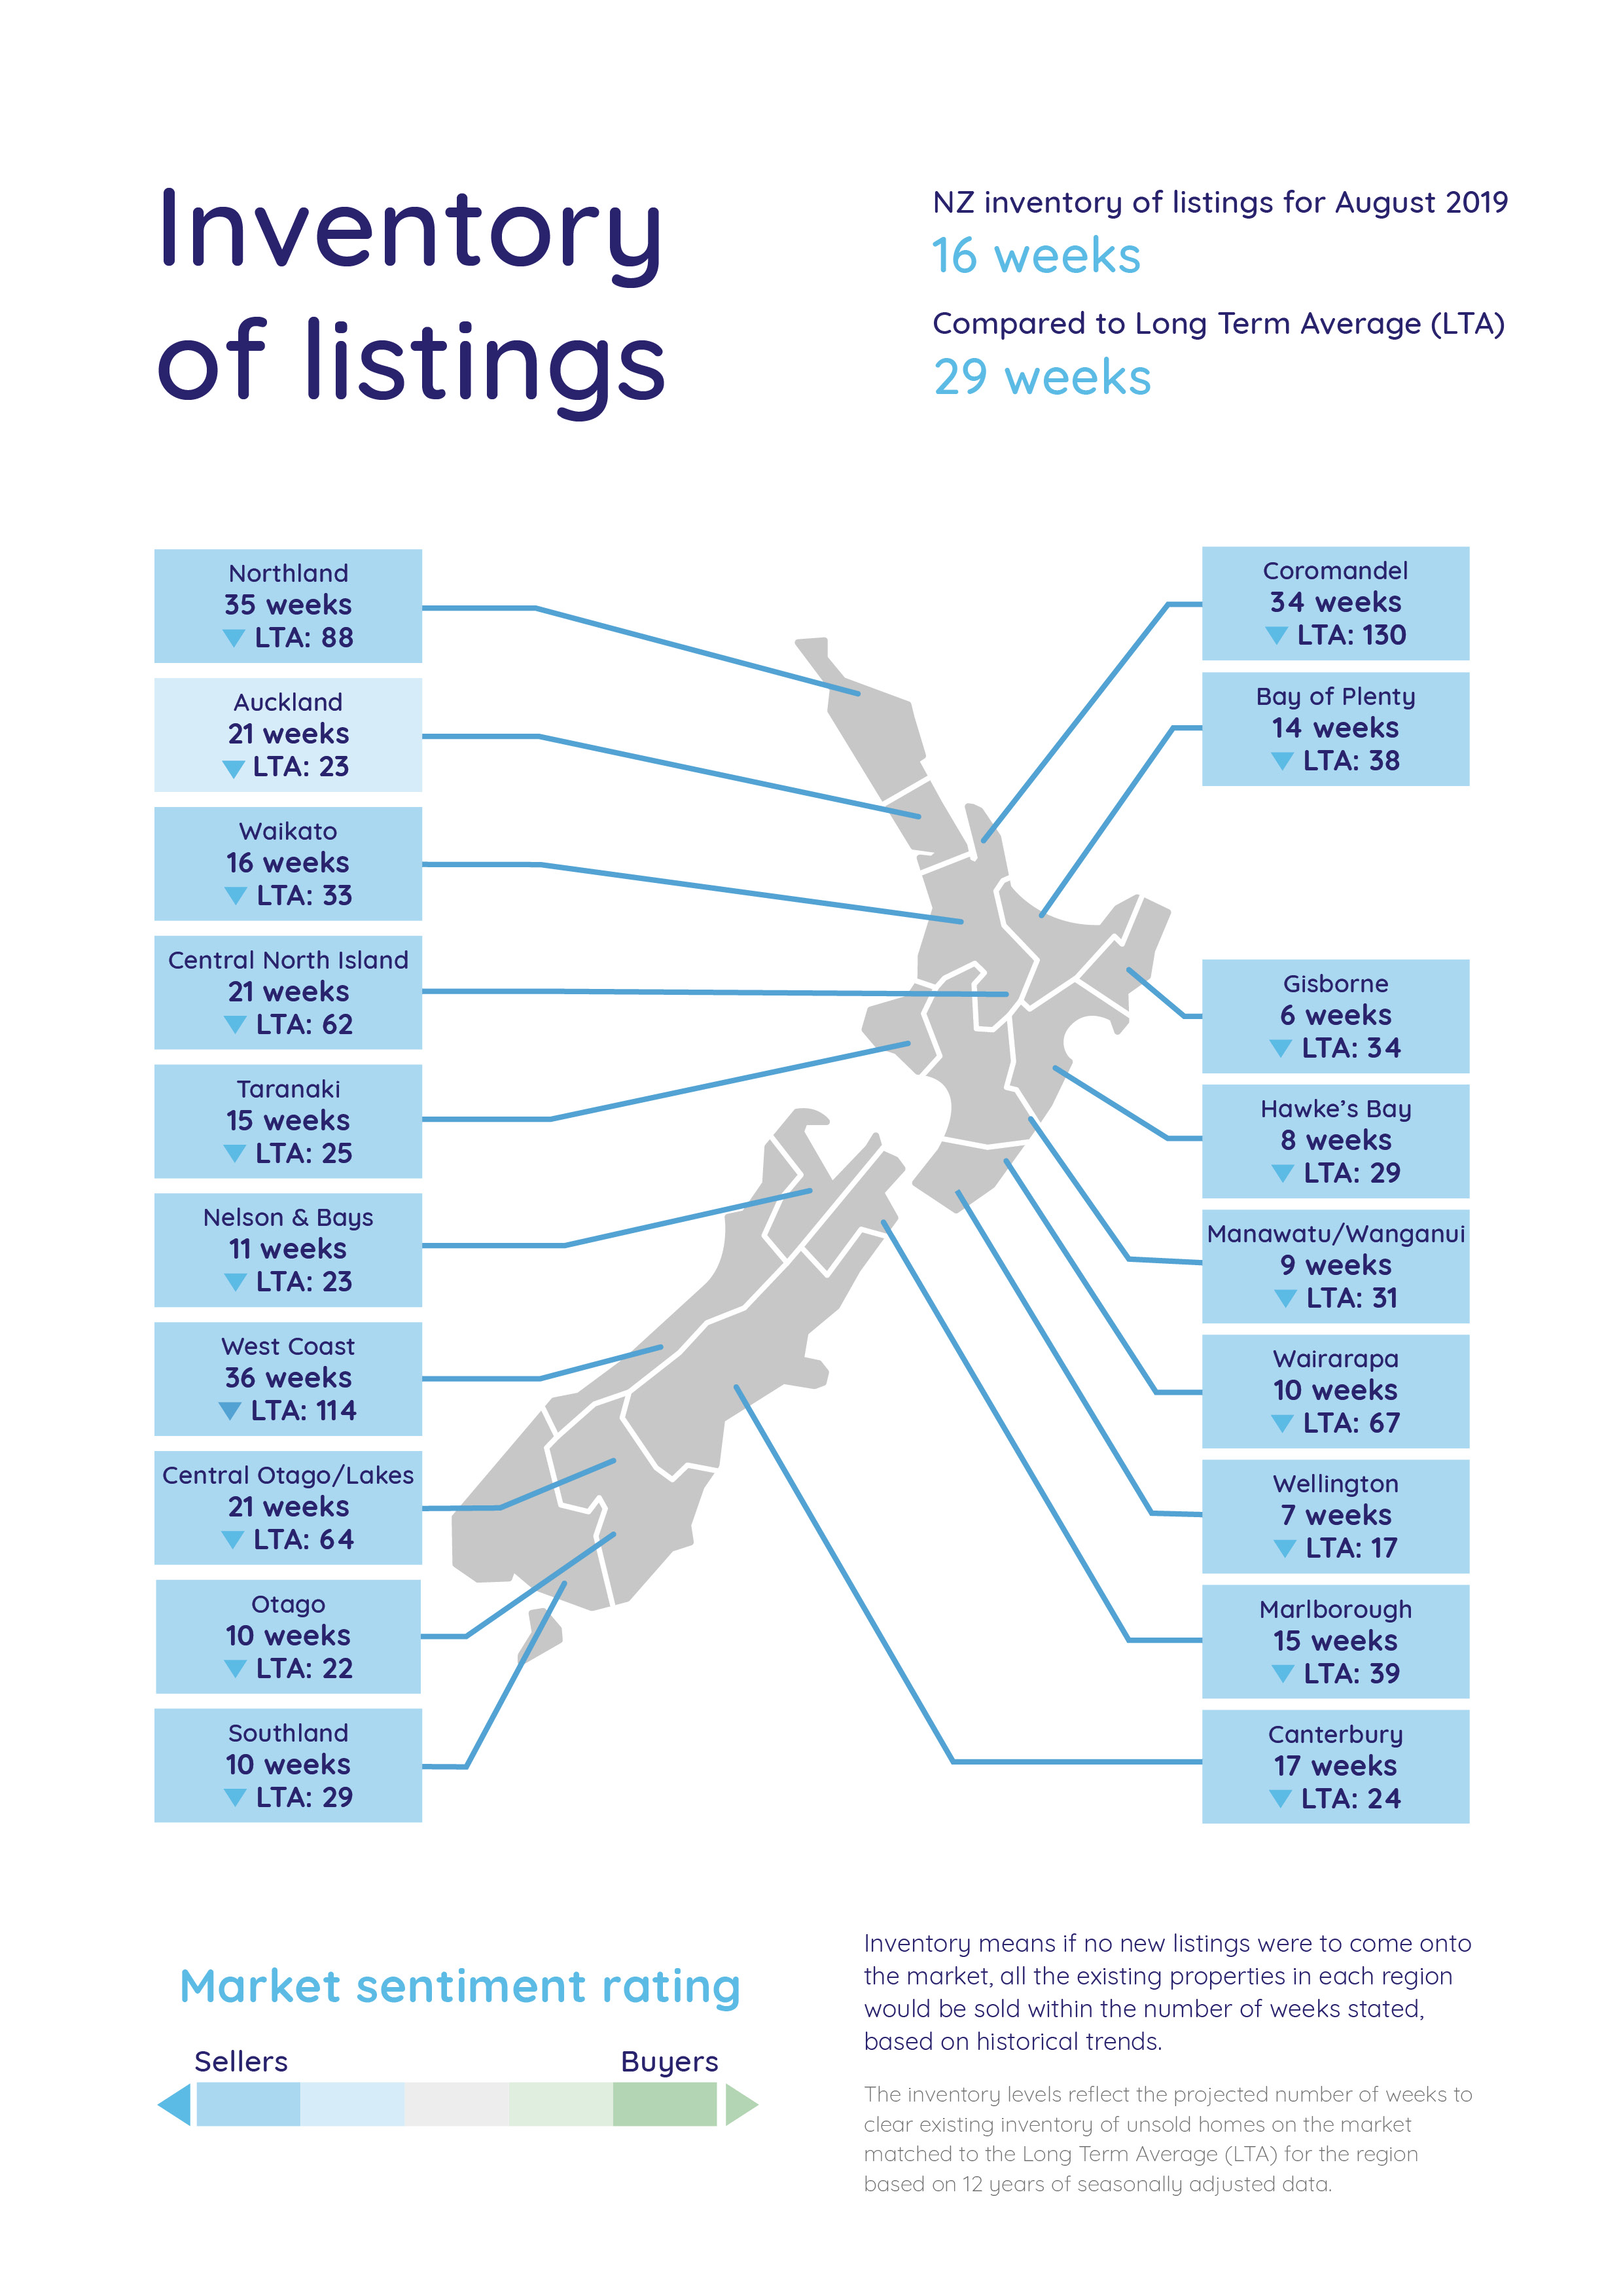
- Inventory is a measure of how long it would take, theoretically, to sell the current stock at current average rates of sale if no new properties were to be listed for sale. It provides a measure of the rate of turnover in the market.
- New listings are a record of all the new listings on realestate.co.nz for the relevant calendar month. As realestate.co.nz reflects 97% of all properties listed through registered estate agents in New Zealand, this gives a representative view of the New Zealand property market.
- Demand: the increase or decrease in the number of views per listing in that region, taken over a rolling three-month time frame, compared to the same three-month time frame the previous year – including the current month.
- Seasonal adjustment is a method realestate.co.nz uses to better represent the core underlying trend of the property market in New Zealand. This is done using methodology from the New Zealand Institute of Economic Research.
- Truncated mean is the method realestate.co.nz uses to provide statistically relevant asking prices. The top and bottom 10% of listings in each area are removed before the average is calculated, to prevent exceptional listings from providing false impressions.
Share
-
.svg)
.svg)
.svg)